
These maps present regions currently experiencing long-term (12 month) anomalies using observed temperature and precipitation data from November 2025 through October 2026 (top) and regions likely to encounter significant water anomalies during the one-year period beginning in August 2026 and running through July 2027 using 3 months of observed data and 9 months of forecast data (bottom).
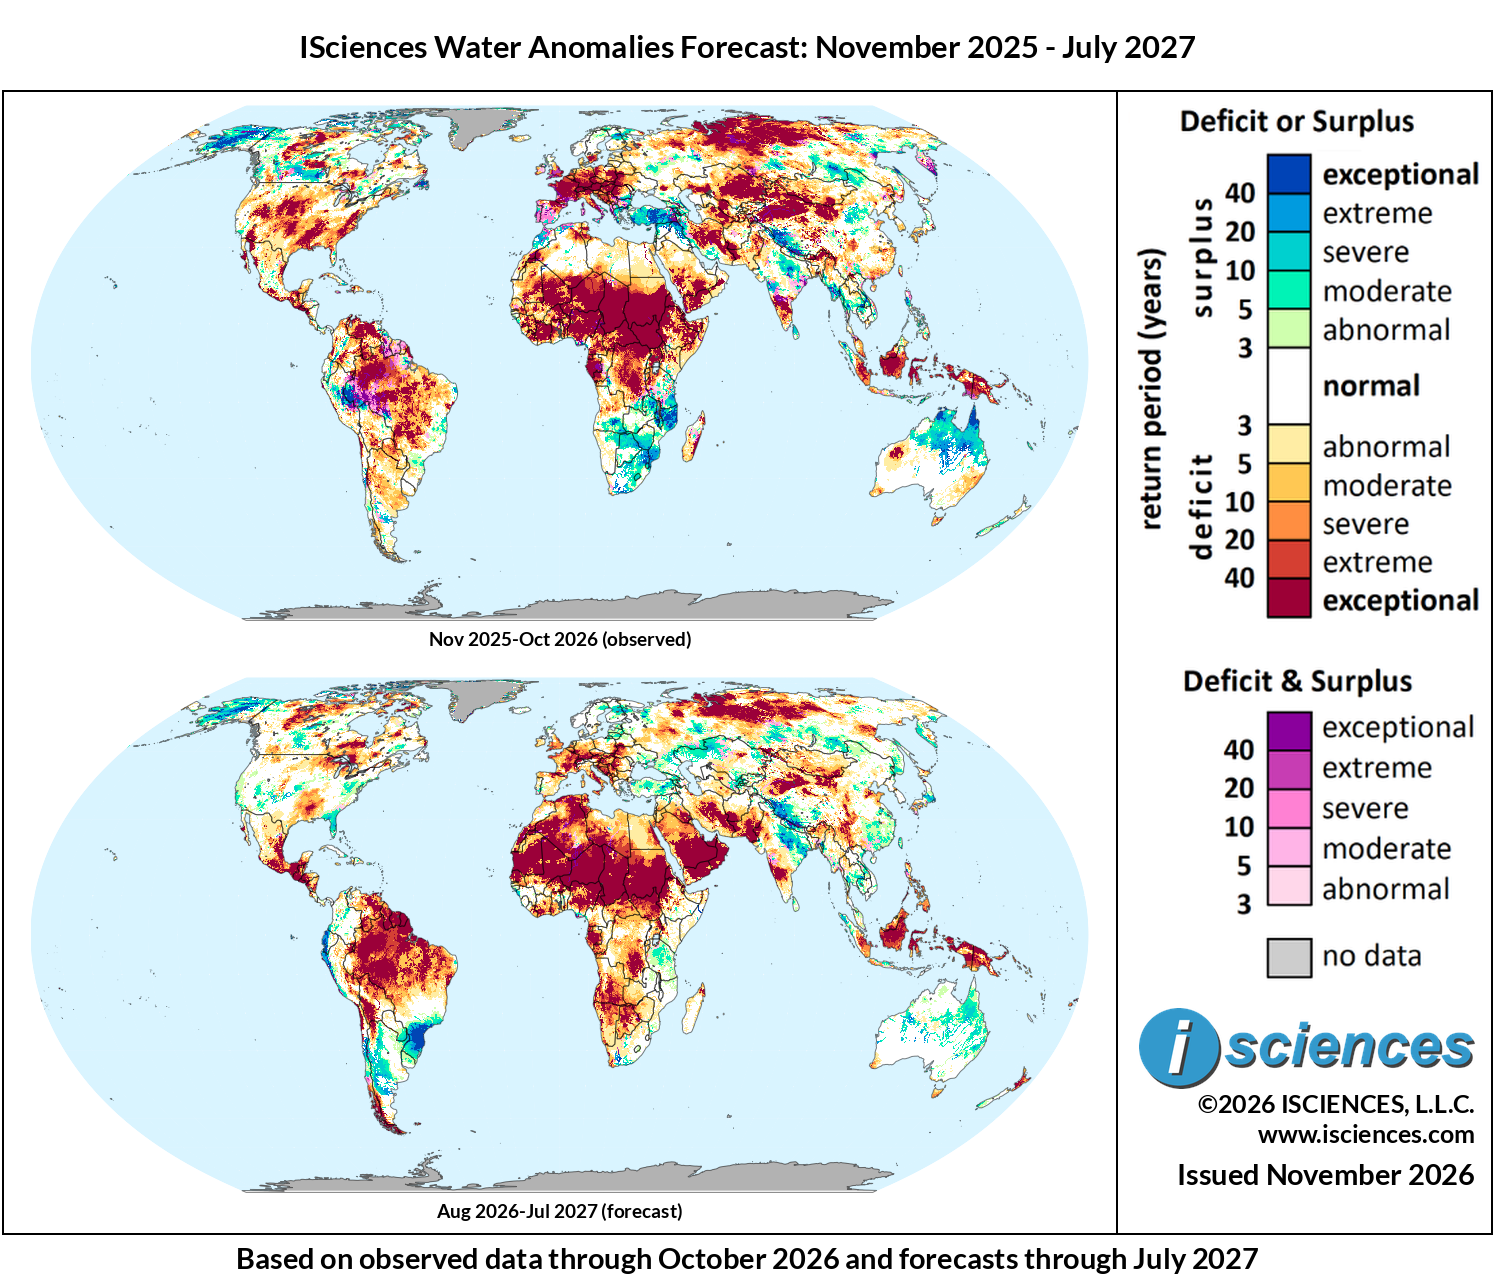
Figure 1: Worldwide water anomaly. Top: 12-month observed, Oct 2025–Sep 2026. Bottom: 12-month forecast, Jul 2026–Jun 2027
The in focus and regional synopsis sections that follow provide highlights of regional water forecasts. Detailed regional maps are available in the full report: ISciences Global Water Monitor & Forecast Watch List November 12, 2026 (pdf).
In Focus
El Niño Reaches Uncharted Territory
El Niño crossed a historic threshold in October. The Copernicus Climate Change Service reported that the monthly average sea surface temperature in the Niño 3.4 region reached an all-time high of 29.94°C, an anomaly of 3.21°C that exceeded the peaks of the very strong 1982–1983, 1997–1998, and 2015–2016 events. WMO Secretary-General Celeste Saulo described conditions as “literally off the monitoring charts that we have used for the past four decades.” The warming does not appear to be finished. Zeke Hausfather’s analysis for Carbon Brief of more than 600 forecasts from 14 climate models points to a peak near 4°C, with 10 of the 14 models placing it in December, and NOAA’s Climate Prediction Center expects strengthening through the end of the year.
NOAA’s relative index – that accounts for overall trends in ocean warming – offers a more measured, though still extraordinary, view. The three-month Relative Oceanic Niño Index of 1.97°C for August–October ranks second for that period since 1950, behind only 1997. The NOAA CFSv2 ensemble that drives WSIM’s forecasts is shown here on the relative Niño 3.4 index (Figure 2). On this index, observed values reached about 2.5°C in October. The ensemble mean peaks near 2.7°C in November, slightly below last month’s projection of 2.8 to 2.9°C, and holds near 2.5°C through January before declining steadily. It falls below 0.5°C around May 2027 and dips just below zero by July. Even before the event peaks, El Niño’s effects have already arrived across the Americas as record floods, extraordinary tides, and deepening drought.
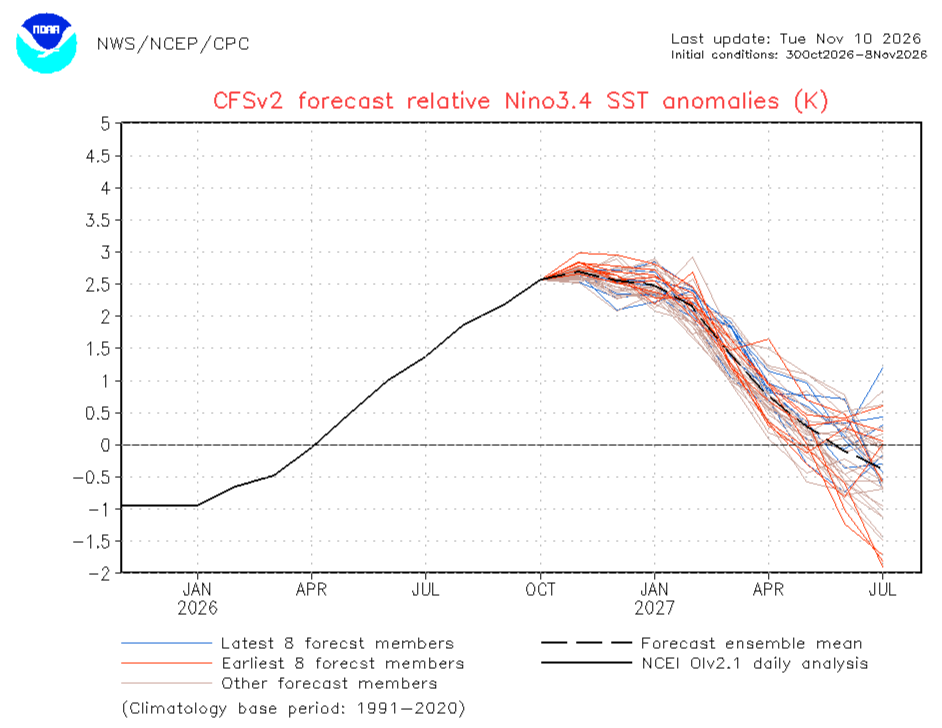
Figure 2: NOAA CFSv2 forecast of relative Niño 3.4 SST anomalies (K), initial conditions October 30 to November 8, 2026. Source: NOAA NWS/NCEP/CPCSource: NOAA NWS/NCEP/CPC.
Floods and Record Tides in the United States
El Niño is bringing heavy rains to the United States well ahead of winter. In late October, one of the most extreme storms in Colorado’s history dropped up to 8 inches of rain on higher elevations in four days. A second storm around November 1 delivered 5 to 7 inches in parts of Arizona and Colorado, more than double the average November precipitation in a single day and killed at least four people. Fifteen river gauges across Arizona, southern Colorado, and western New Mexico set all-time flood crest records, and the San Juan River crested at 16.81 feet at Pagosa Springs, surpassing the 15-foot crest of the previous storm. Colorado state climatologist Russ Schumacher told Grist that after the first storm “everything was primed for even worse flooding this time around,” and that “the El Niño connection is pretty clear.” Florida’s central coast took the next blow. Two feet of rain fell in 36 hours at Malabar on November 1 and 2, a once-in-1,000-year event for the region, and Melbourne recorded 11.51 inches on November 2, its wettest day in 89 years. “We are seeing the hydroclimate effects of a very strong El Niño event occurring now but with a boost from climate change,” climate scientist Daniel Swain told Scientific American.
The rains brought a measure of relief to the Colorado River Basin, which we described two issues ago as being at a breaking point. Lake Powell rose more than 20 feet from its mid-September low, “somewhat of an unexpected boost from Mother Nature” in the words of University of Colorado Boulder climate scientist Martin Hoerling. However, the reservoir remains just over a quarter full, and 15 of its 17 boat launches were still unusable in early November. Schumacher cautioned that “it’s a long way to go to get even back to where we were a year ago,” and much now depends on how much snow accumulates in the mountains this winter after a record-low snowpack earlier this year (more on that next month).
Along the Pacific coast, El Niño’s effects have not needed rain at all. NOAA tide gauges at San Diego, La Jolla, Los Angeles, and Santa Barbara hit their highest water levels on record between October 24 and 30, flooding streets on otherwise clear days in places like San Diego’s Mission Beach. At San Diego, observed water levels ran more than a foot above the astronomical tide prediction for the entire week and peaked near 8.5 feet on October 27 (Figure 3). Explaining a follow-up coastal flood advisory in November, the National Weather Service attributed just 0.4 feet of the 1.6 feet of extra water to astronomy. The rest came from the thermal expansion of ocean water warmed by El Niño and its Kelvin waves, climate change, and California’s marine heat wave.
The highest tides may still be ahead. NOAA expects king tides from November 22 to 27 and again from December 22 to 26, and National Weather Service meteorologist Dylan Flynn called the high water of early November “just a preview of much worse coastal flooding” expected during Thanksgiving week. NASA’s Josh Willis expects sea level to keep rising and probably peak in February, with “every storm surge and high tide” arriving “with an extra foot or two of water on top of it.” South Florida saw its own chart-topping king tides in late October, days before the November rains arrived.
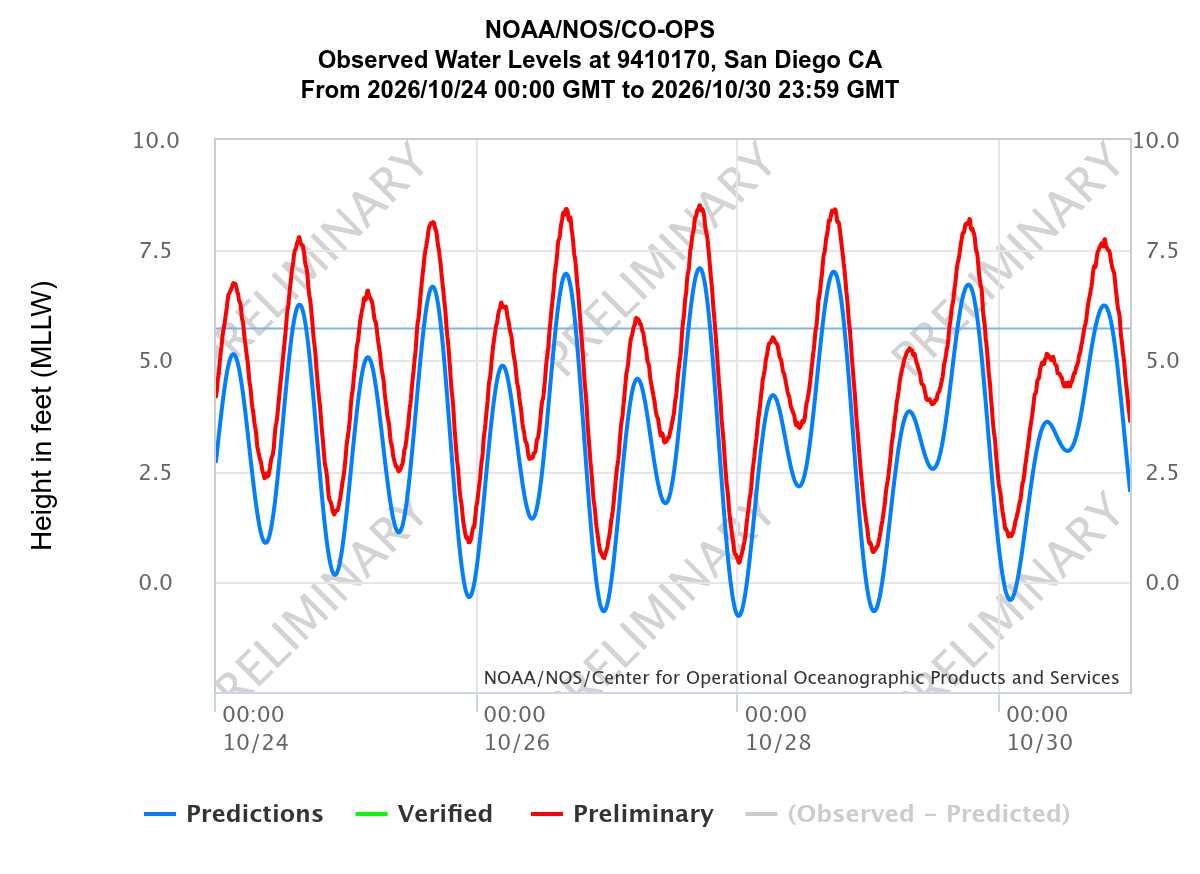
Figure 3: Observed (red) and predicted (blue) water levels at San Diego, California, October 24–30, 2026, in feet above mean lower low water. The light blue horizontal line marks mean higher high water, the long-term average of the higher daily high tide. Data are preliminary. Source: NOAA/NOS CO-OPS
The coming winter is likely to compound these risks. NOAA’s winter outlook favors wetter-than-average conditions across the southern tier from California to Florida and along the East Coast, with the highest odds centered on northern Florida and southeastern Georgia (Figure 4). California faces particular exposure. Eight of 10 seasonal forecast models analyzed by Swain gave at least 10% odds that one or more months from January through March 2027 would be the wettest on record in Southern California, Central California, or both. Total rainfall alone does not determine the damage, however. The El Niño winter of 1997–1998 brought more than double California’s average rainfall but ranks only 13th for destructiveness because the rain was spread over so many days, while the drier winter of 1982–1983 ranks fourth. WSIM’s forecast (Figure 7) is consistent with NOAA’s outlook, with surpluses across Arizona, New Mexico, southern Colorado, and Florida in November–January, spreading to the California coast and the Southeast Atlantic seaboard by February–April, while exceptional deficits build around Lake Superior.
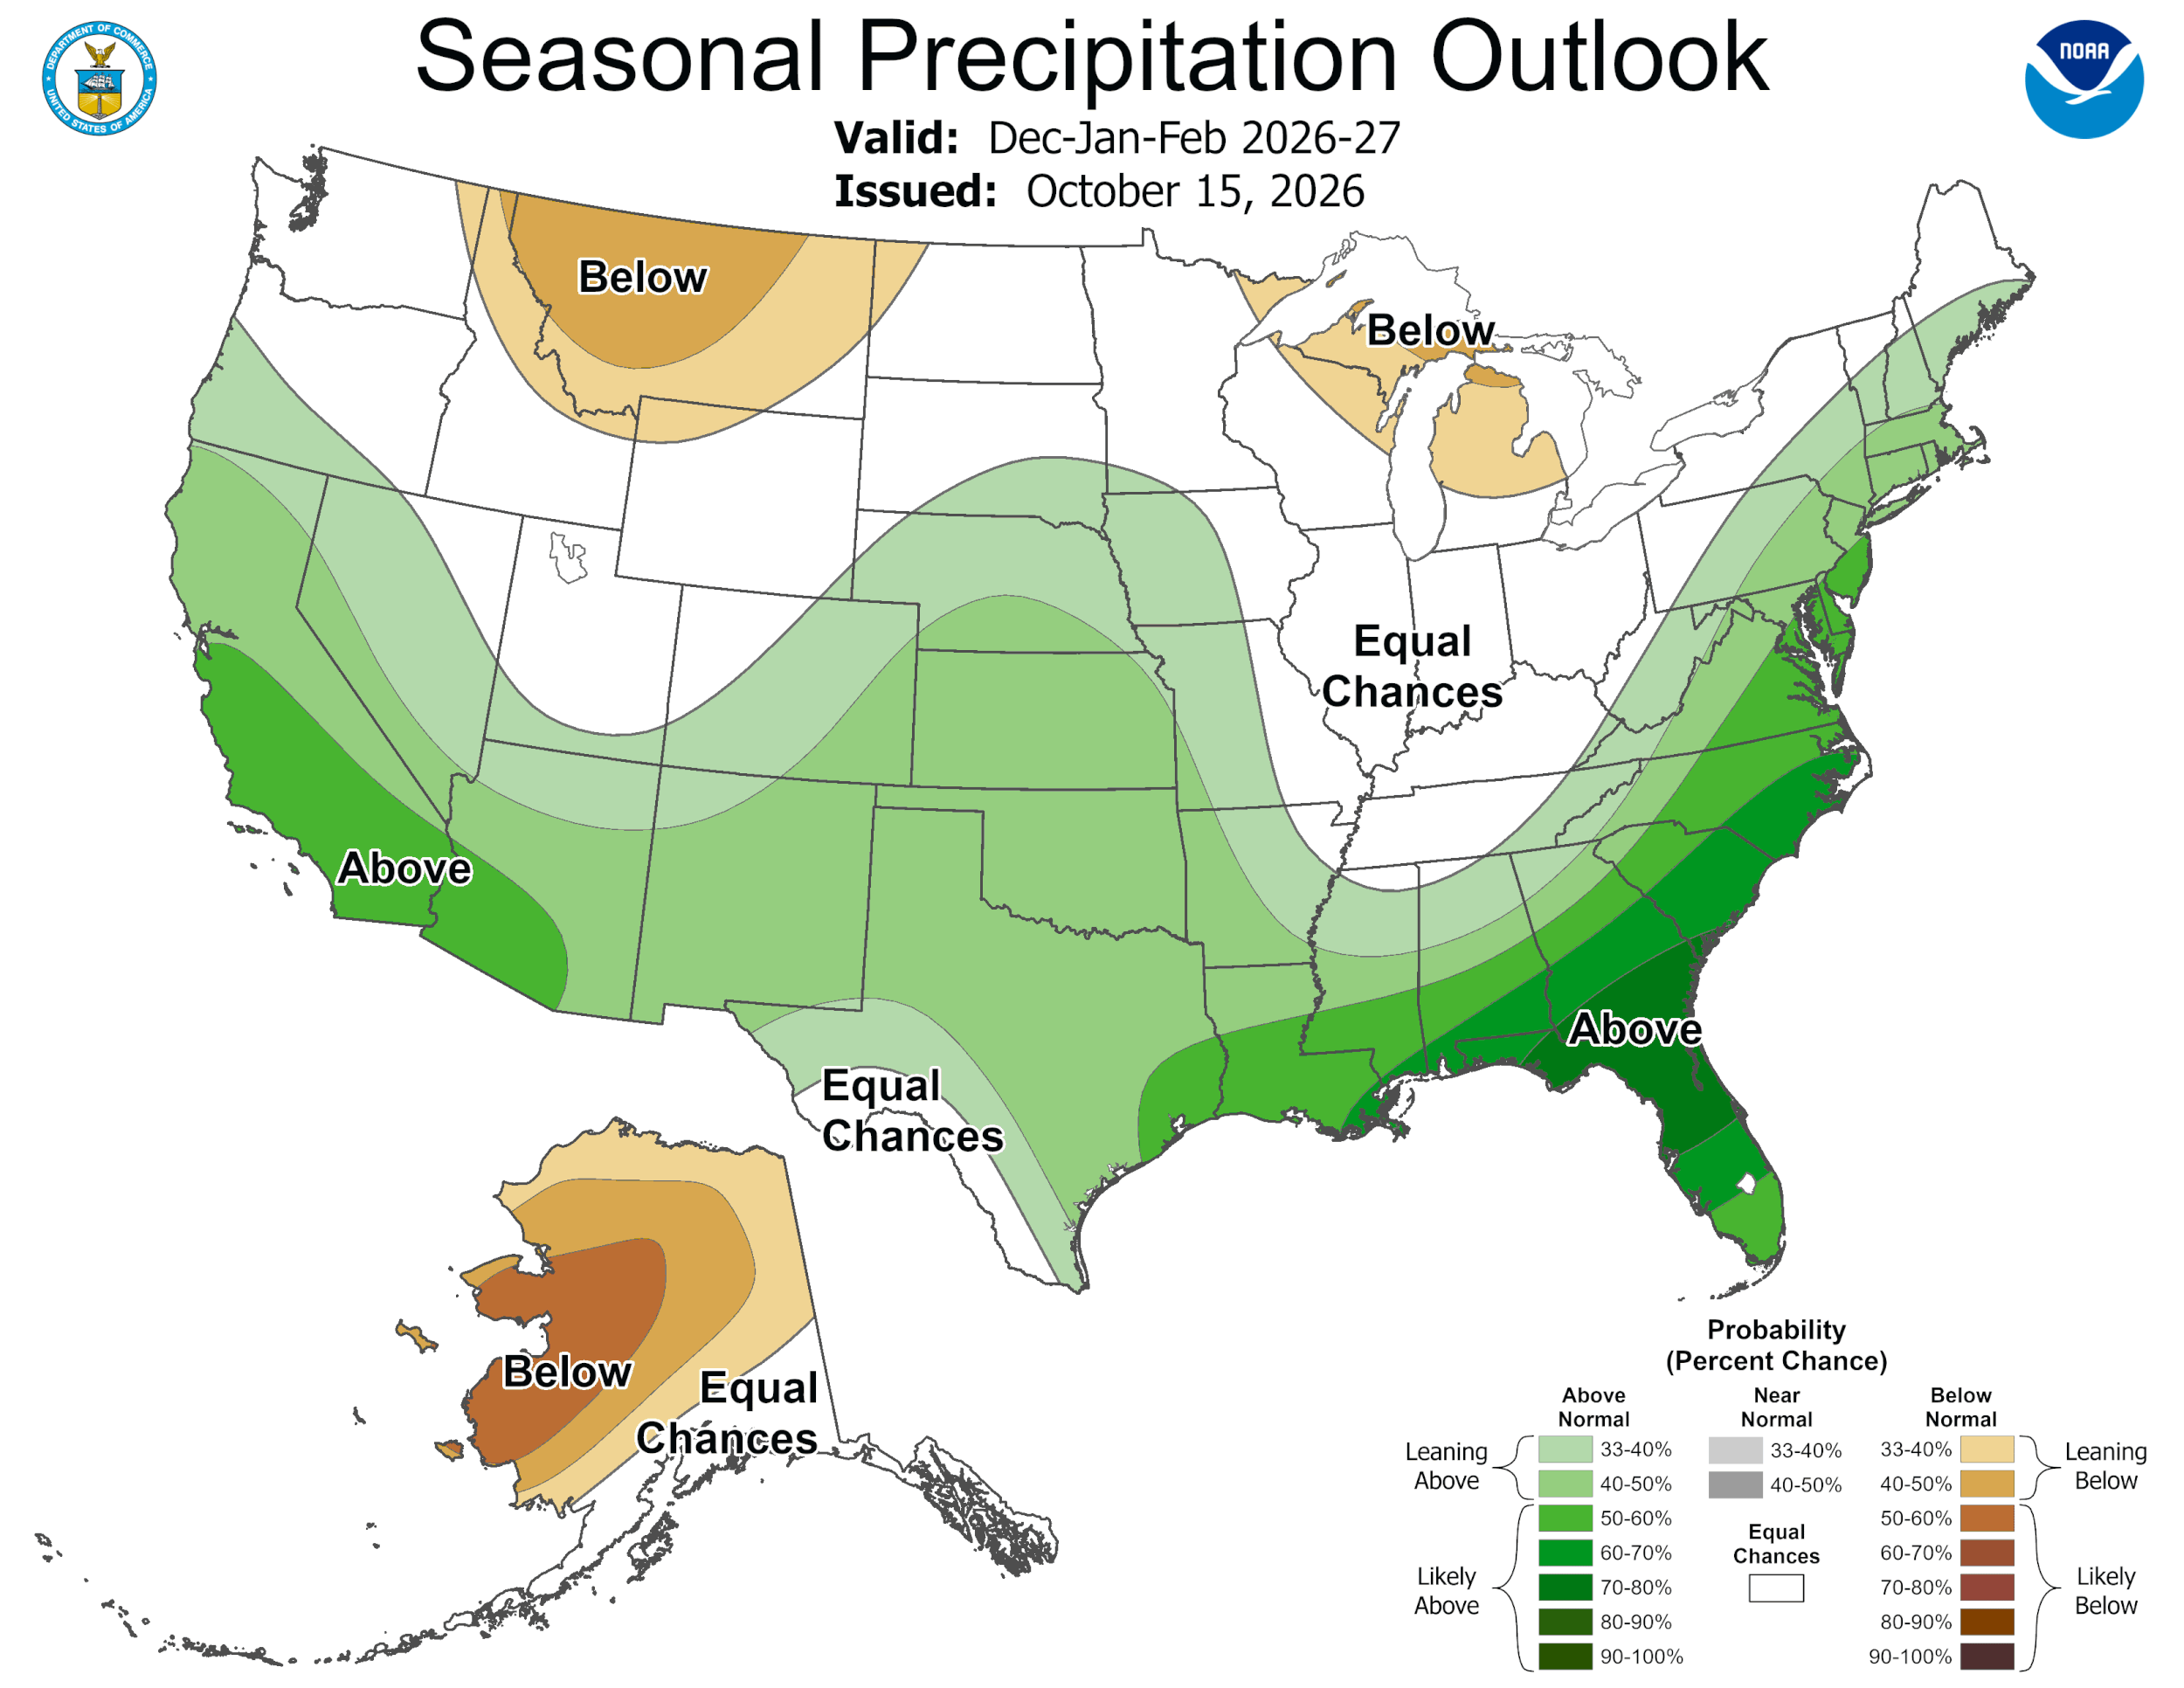
Figure 4: NOAA seasonal precipitation outlook for December 2026–February 2027, issued October 15, 2026. Shading shows the probability of above-normal (green) or below-normal (brown) precipitation. Source: NOAA NWS Climate Prediction Center.
The Dry Corridor Turns to Cloud Seeding
In Honduras, the drought has become severe enough that the government paid a Mexican company $750,000 for 20 cloud-seeding flights, spraying silver iodide into the skies over parched mountain cornfields. A spokesperson for the agriculture ministry says the flights have boosted rainfall by 20% to 60% in key areas compared to projections. Nabil Kawas, a meteorologist and former dean of sciences at the National Autonomous University of Honduras, says a previous cloud-seeding program during comparable droughts raised rainfall by less than 10%. He calls the effort “an experiment” and argues that the money would have done more for poor farmers if spent on irrigation or reservoirs. In the village of Nueva Concepción, 81-year-old farmer Carlos Alberto Hernández, who watched his first crop of the year die, wants help digging wells. “Without water, we’re left with nothing,” he told the Associated Press.
The crop failures we reported in our September newsletter have since deepened into a regional emergency. The same ministry spokesperson estimates that farmers like Hernández have lost 80% to 90% of their crops this year, and World Food Programme aid coordinator Aníbal Zúñiga says that “families are going to bed with one or two meals a day” after selling their animals and tools. WFP regional director Lena Savelli writes that drought “has evolved from a distant threat to reality and, today, an emergency,” and that the number of food-insecure people in Central America could increase by as much as 80%. WFP is now providing food and cash assistance to more than 470,000 people across the region, and in Nicaragua it has doubled the meals provided through the national school feeding program to reach 300,000 children in the hardest-hit areas. Government responses have varied. El Salvador declared a six-month state of emergency and Guatemala approved tariff-free staple grain imports; Nicaragua’s exiled opposition has criticized the lack of any emergency declaration there.
Recent rains have allowed some farmers to replant, but the outlook offers little reassurance. WSIM’s observed August–October anomalies (Figure 11) show exceptional deficits from Chiapas through Guatemala, El Salvador, and Honduras, and the forecast keeps severe to exceptional deficits across much of the corridor through July 2027, strongest in Chiapas and Guatemala. In Honduras, WSIM’s population exposure estimates (Figure 5) show deficits reaching nearly the entire population by June 2026, months after surpluses had covered most of it, and the forecast keeps most Hondurans exposed to deficits through July 2027, with more than half facing severe or worse deficits by May.
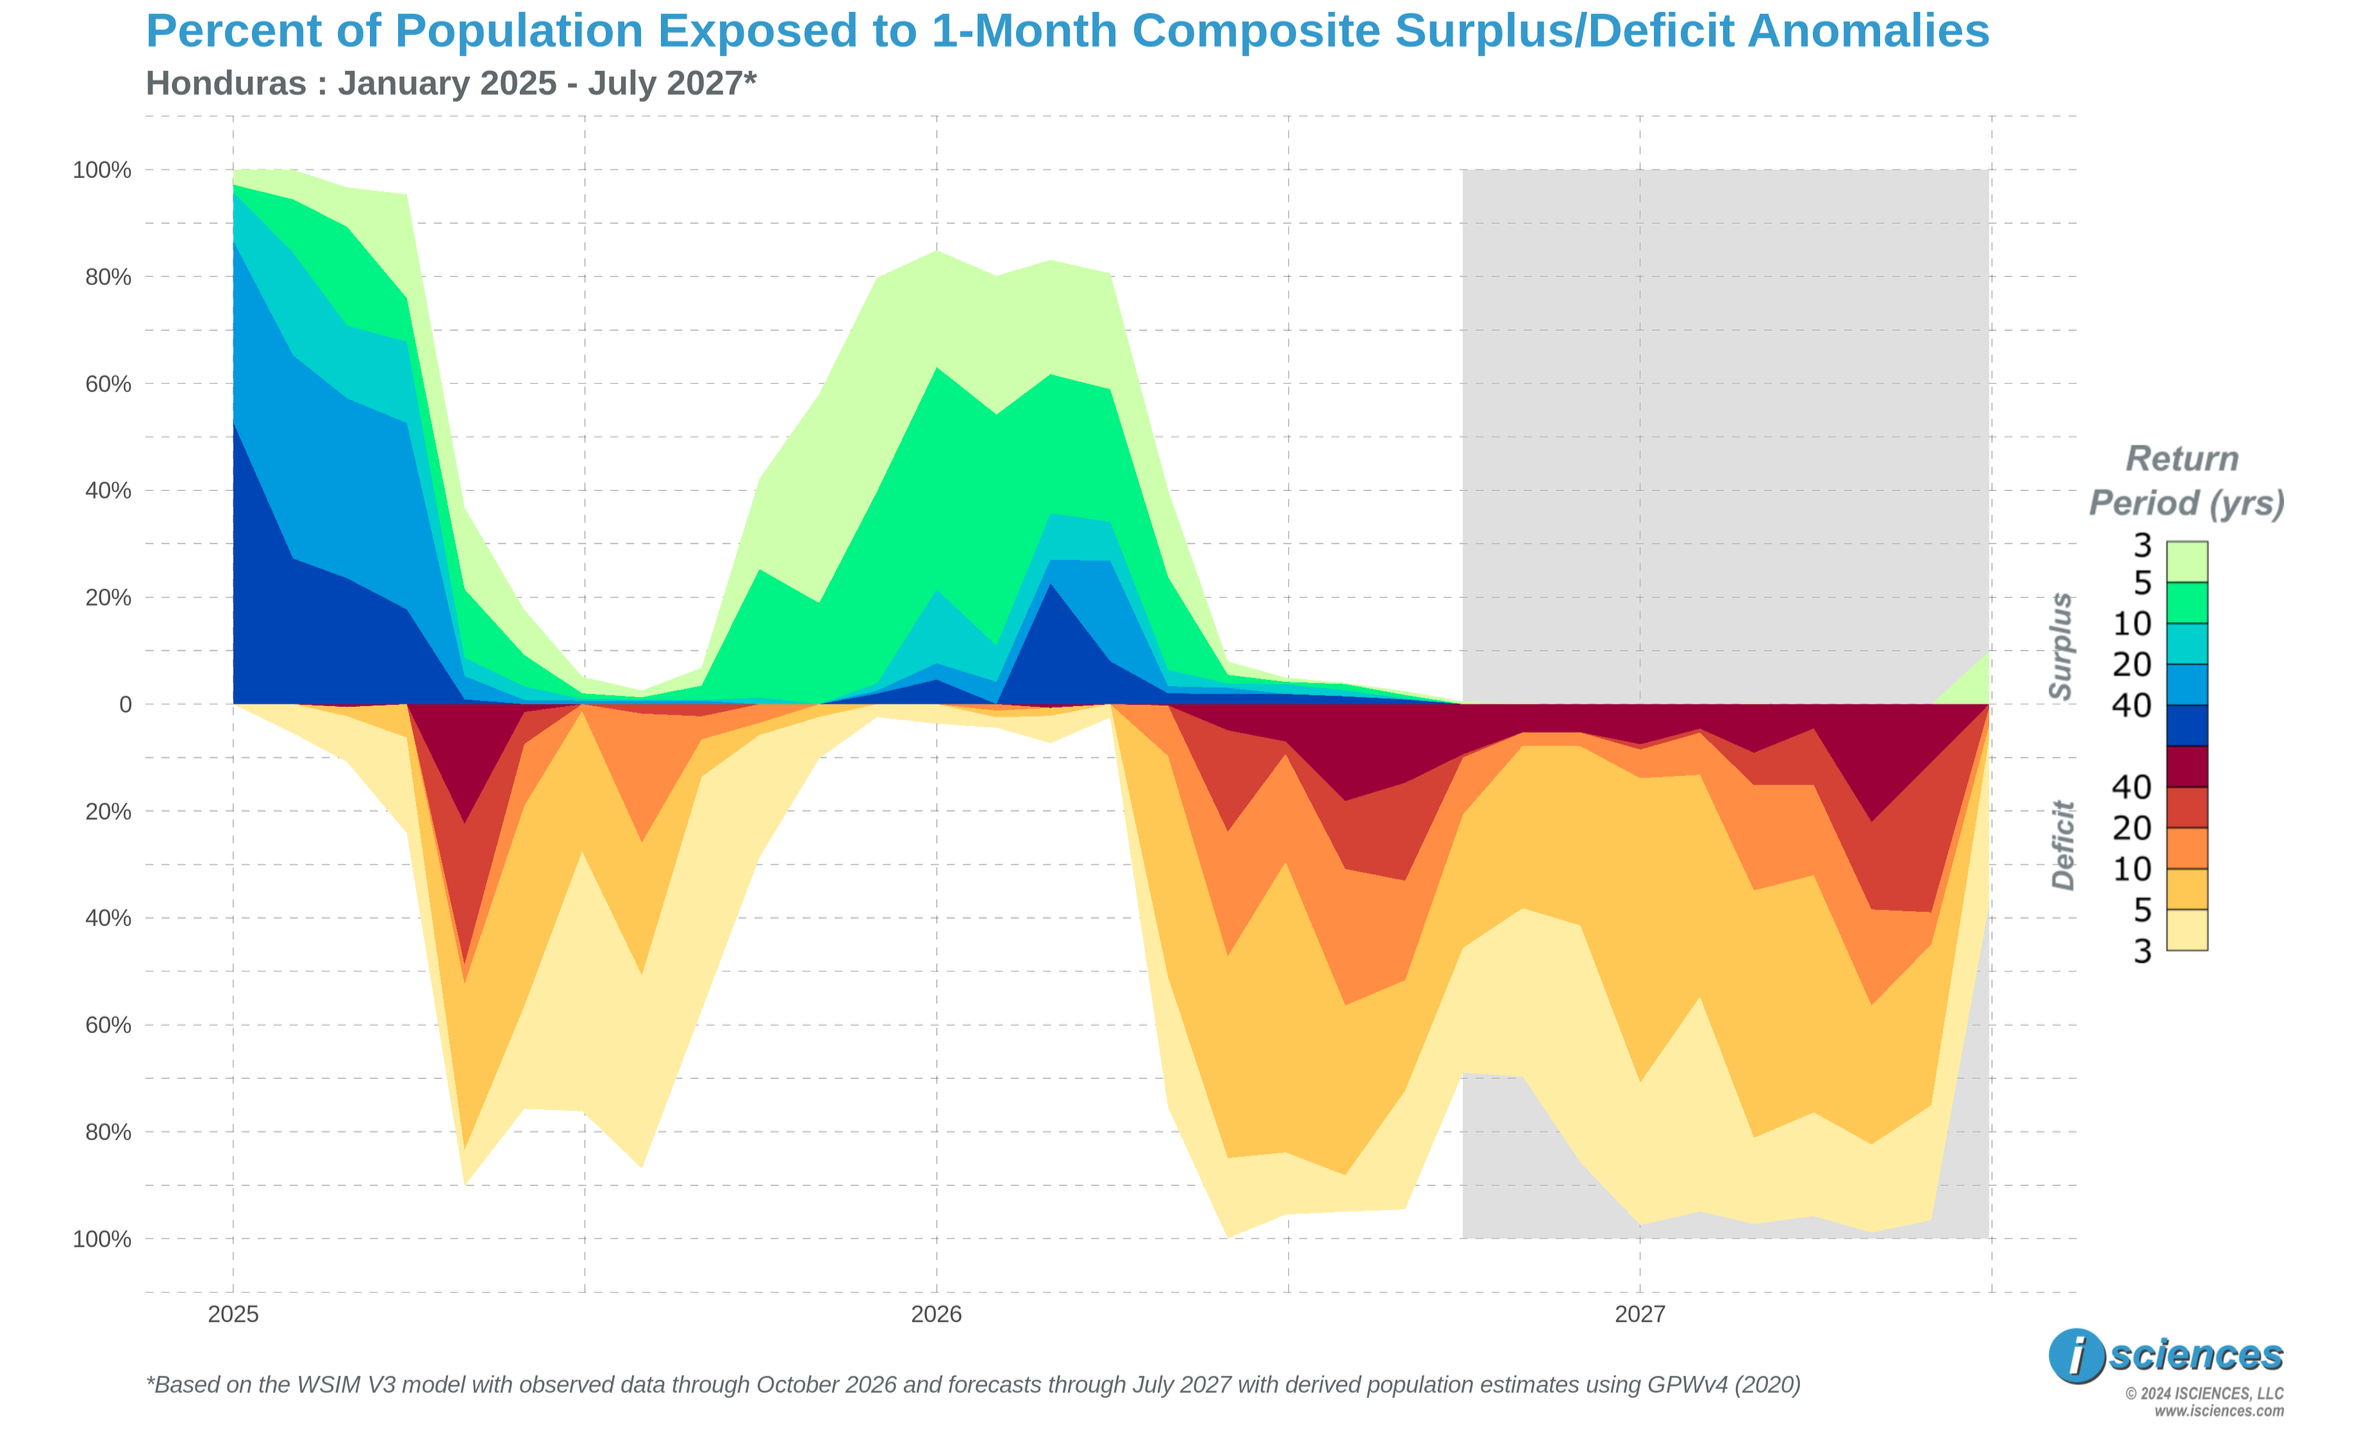
Figure 5: Percent of the population of Honduras exposed to 1-month composite surplus and deficit anomalies, January 2025 to July 2027. The shaded period is forecast, based on observed data through October 2026. Source: ISciences WSIM V3, with population estimates from GPWv4.
South America: Floods at Both Ends of a Drought
On South America’s Pacific coast, El Niño has delivered heavy rains driven by what Swain calls “absurd” ocean warming. Peru’s meteorological service, SENAMHI, placed 11 provinces in Tumbes and Piura under red alert through November 8 after record-breaking early November rainfall. In Tumbes alone, 324 people were displaced, 808 were affected, and 109 homes were left uninhabitable. To the north, 20 rivers had overflowed along Ecuador’s coast by November 9, up from 15 a day earlier, with the most overflow points in Guayas and Manabí. Peru’s anchovy fishery, an industry typically worth $2 billion to $3 billion, closed unusually early this year, and global fishmeal output in September was about half of what it had been a year earlier. Peruvian growers cut their 2026–2027 blueberry export forecast by 4.4%, citing smaller berries and weaker yields, and Fairtrade reports that extreme weather is already affecting banana production in Colombia, Peru, and Ecuador.
Far to the southeast, the Paraná River surged past evacuation thresholds in northeastern Argentina in late October, killing two rural workers. At Itatí, the river stood 78 centimeters above the town’s 7.5-meter evacuation mark, and authorities at Iguazú Falls closed the walkways on October 12 after the Iguazú River’s flow passed 12,000 cubic meters per second, about eight times its usual flow. In Chaco province, 2,239 people from 629 households remained evacuated or displaced on November 7, even as the river began to recede.
While coastal floods are raising alarm, much of the interior is drying out. Bolivian President Rodrigo Paz declared a national emergency on October 31 as drought affected at least 78,200 families in seven of the country’s nine departments, warning that El Niño “will hit very hard, with both drought and flooding.” Brazil grows nearly 40% of the world’s coffee, and although its current crop is forecast to set a record, the Brazilian Coffee Industry Association has warned that excessive heat and irregular rain during flowering could cut the next harvest by up to a fifth. WSIM’s seasonal forecast for South America (Figure 13) confirms this split. For November–January, exceptional surpluses hug the coast of Ecuador and northern Peru and cover southern Brazil around Paraná, while severe to exceptional deficits blanket the interior from Venezuela south across the Amazon basin into Bolivia, a drought footprint spanning much of the northern half of the continent. Those interior deficits persist across the Amazon into April and along the Altiplano through July.
Watch List: Regional Synopsis
This synopsis provides highlights of regional water forecasts. More detailed analysis is available in “Watch List: Regional Details” immediately following the synopsis.
United States: Observed long-term conditions (Nov 2025–Oct 2026; Figure 6) show moderate to exceptional deficits across most of the contiguous U.S., with exceptional cores spanning the central Rockies from Nevada and Utah through Wyoming and Colorado into Nebraska, southern Arizona, the lower Mississippi Valley from eastern Texas through Arkansas and Louisiana, and the Mid-Atlantic from South Carolina to south-central Pennsylvania. In contrast, Alaska exhibited widespread severe to exceptional surpluses. The seasonal forecasts (Aug 2026–Jul 2027; Figure 7) project El Niño-driven surpluses across Arizona, New Mexico, and southern Colorado and along the Florida and Georgia coasts in Nov 2026–Jan 2027, expanding to the California coast and up the Atlantic seaboard to New England by Feb–Apr 2027. However, moderate to severe deficits linger across Arkansas, Mississippi, and Tennessee into Jan 2027, and exceptional deficits persist around the Great Lakes region through Jul 2027.
Canada: Observed long-term conditions (Nov 2025–Oct 2026; Figure 8) show severe to exceptional surpluses across the Yukon and central Alberta and southern Saskatchewan, contrasting with exceptional deficits in the Northwest Territories between Great Bear and Great Slave Lakes, across northern Saskatchewan and Manitoba, and in northern Ontario west of James Bay. Severe to extreme deficits were observed in New Brunswick and Nova Scotia, while exceptional surpluses covered eastern Newfoundland. The seasonal forecasts (Aug 2026–Jul 2027; Figure 9) project exceptional deficits persisting around Great Slave Lake through Jul 2027 and across northern Ontario and the north shore of Lake Superior through Apr 2027, while surpluses emerge along the Hudson Bay coast of Manitoba and across eastern Quebec and Labrador by Feb–Apr 2027. By May–Jul 2027, deficits are expected to spread across much of Ontario and southern Quebec.
Mexico, Central America, and the Caribbean: Observed long-term conditions (Nov 2025–Oct 2026; Figure 10) show exceptional deficits along the Gulf of California coast in Sonora and Baja California Sur, in Tamaulipas, and along the Pacific coast from Jalisco through Guerrero and Oaxaca, continuing through Chiapas into Guatemala, El Salvador, Honduras, and western Nicaragua. Western Cuba also registered exceptional deficits, while Jamaica showed mixed conditions. The seasonal forecasts (Aug 2026–Jul 2027; Figure 11) project near-normal conditions across most of Mexico in Nov 2026–Jan 2027, but exceptional deficits persist across Chiapas, Guatemala, and El Salvador and return across Michoacán, Guerrero, Puebla, and Oaxaca in Feb–Apr 2027, expanding into Veracruz and along the Sierra Madre Occidental by May–Jul 2027. Moderate surpluses are expected across Hispaniola and eastern Cuba from Feb 2027.
South America: Observed long-term conditions (Nov 2025–Oct 2026; Figure 12) show exceptional deficits across Venezuela’s Orinoco basin, the northern and central Amazon in Amazonas, Roraima, and Pará, and south through Mato Grosso into eastern Bolivia, with moderate to severe deficits extending across Paraguay and much of Argentina. The western Amazon along the Peru-Brazil-Bolivia border exhibited exceptional surpluses and mixed conditions. The seasonal forecasts (Aug 2026–Jul 2027; Figure 13) project exceptional surpluses along the coasts of Ecuador and northern Peru and across southern Brazil in Paraná and Santa Catarina in Nov 2026–Jan 2027, spreading into Paraguay, Uruguay, and northeastern Argentina by Feb–Apr 2027. Exceptional deficits are expected to persist across the Amazon basin into Apr 2027 and along the Altiplano of southern Peru and Bolivia through Jul 2027.
Europe: Observed long-term conditions (Nov 2025–Oct 2026; Figure 14) show an exceptional deficit core stretching from northeastern Spain across France, Germany, Switzerland, Austria, Czechia, and Poland into Hungary and western Ukraine, with exceptional deficits also across Italy, the western Balkans, and southern Sweden. Mixed conditions covered Wales, Ireland, western Iberia, and the southern Balkans, while surpluses were limited to northern Finland and Sweden. The seasonal forecasts (Aug 2026–Jul 2027; Figure 15) project deficits easing to moderate levels across France and Germany in Nov 2026–Jan 2027, though exceptional deficits persist across the Alps from Switzerland into Austria. By Feb–Apr 2027, El Niño is expected to bring normal to moderate surplus conditions to most of the continent, while deficits remain in the Poland-Belarus-Ukraine border zone through Jul 2027 and in central Russia east of Moscow through Apr 2027.
Africa: Observed long-term conditions (Nov 2025–Oct 2026; Figure 16) show exceptional deficits across the Sahel from Mauritania and Mali through Niger, Chad, Sudan, and South Sudan into western Ethiopia, extending south through the Central African Republic, the Democratic Republic of the Congo, and along the coast of Gabon. Severe to exceptional surpluses blanketed Tanzania, Malawi, Mozambique, Zambia, Zimbabwe, eastern South Africa, and parts of southeastern Angola. The seasonal forecasts (Aug 2026–Jul 2027; Figure 17) project exceptional deficits persisting across the Sahel from Senegal to Sudan through Jan 2027 and shifting south into southern Chad, the Central African Republic, and South Sudan in Feb–Apr 2027; at the same time, severe to exceptional deficits are also expected to emerge across central Angola. Moderate surpluses continue in western Tanzania around Lake Victoria, and by May–Jul 2027 surpluses are expected to spread north across South Sudan and western Ethiopia as deficits concentrate in the central Sahara.
Middle East: Observed long-term conditions (Nov 2025–Oct 2026; Figure 18) show extreme to exceptional surpluses across central and eastern Turkey and the headwaters of the Euphrates and Tigris, with exceptional mixed conditions in southeastern Turkey and moderate to exceptional surpluses tracing the Zagros Mountains toward the Persian Gulf. Exceptional deficits covered much of northern, central, and eastern Iran, Yemen, and southern Saudi Arabia from the Asir highlands into the Rub’ al Khali. The seasonal forecasts (Aug 2026–Jul 2027; Figure 19) project surpluses persisting across Turkey’s Anatolian plateau through Apr 2027, while exceptional deficits continue across Oman and Yemen’s Hadramawt. By May–Jul 2027, exceptional deficits are expected to return along the Zagros and across southern Iran, and expand across southwestern Saudi Arabia.
Central Asia and Russia: Observed long-term conditions (Nov 2025–Oct 2026; Figure 20) show exceptional deficits across western Siberia from the Yamal and Gydan Peninsulas south through the Ob basin, with surpluses limited to areas west of the Ural Mountains and east of Lake Baikal. Exceptional deficits also stretched across northern, central, and eastern Kazakhstan and south through Uzbekistan and Turkmenistan toward the Caspian Sea, while the mountainous border region of Kyrgyzstan, Tajikistan, and the Fergana Valley showed a patchwork of moderate to exceptional deficits and mixed conditions. The seasonal forecasts (Aug 2026–Jul 2027; Figure 21) project exceptional deficits persisting across western Siberia through Apr 2027 before contracting toward the lower Ob, while Kazakhstan, Uzbekistan, and Turkmenistan return to near-normal conditions in Nov 2026–Jan 2027 and surpluses spread across northern Kazakhstan by Feb–Apr 2027. In Kyrgyzstan and Tajikistan, mixed conditions give way to severe to exceptional surpluses in the Amu Darya and Syr Darya headwaters in Feb–Apr 2027.
South Asia: Observed long-term conditions (Nov 2025–Oct 2026; Figure 22) show exceptional surpluses across Nepal and the central Himalaya along the Tibetan border, with moderate to exceptional surpluses extending across Madhya Pradesh, Uttar Pradesh, and Chhattisgarh. Exceptional deficits covered Balochistan and southwestern Afghanistan, the eastern Himalaya across Bhutan, Assam, and Arunachal Pradesh, and the southern interior across Karnataka and southern Andhra Pradesh, with mixed conditions in Maharashtra, West Bengal, and along the Odisha coast. The seasonal forecasts (Aug 2026–Jul 2027; Figure 23) project Himalayan surpluses persisting through Apr 2027, while exceptional deficits spread across Gujarat, southern Rajasthan, Sindh, and the Konkan coast in Nov 2026–Jan 2027 and persist along the Gujarat coast into Apr 2027. By May–Jul 2027, most of India returns to near-normal conditions, with moderate surpluses emerging across West Bengal and Bangladesh.
Southeast Asia and the Pacific: Observed long-term conditions (Nov 2025–Oct 2026; Figure 24) show exceptional deficits across Borneo, Sulawesi, southern Sumatra, and New Guinea, with severe deficits along Java and the southern Malay Peninsula. Mainland surpluses were concentrated in southern Myanmar, Thailand, Laos, and central Vietnam. The seasonal forecasts (Aug 2026–Jul 2027; Figure 25) project existing maritime deficits to persist, with lesser intensity, through Jan 2027. Conditions are expected to normalize across the mainland, Sumatra, western Borneo, southern Sulawesi, Java, and southern New Guinea by Apr 2027, before transitioning to moderate surpluses by May–Jul 2027. Conversely, deficits are expected to remain in the southern Philippines, eastern Borneo, northern Sulawesi, and northern New Guinea through Apr 2027 and intensify in May–Jul 2027.
East Asia: Observed long-term conditions (Nov 2025–Oct 2026; Figure 26) show exceptional deficits blanketing Xinjiang from the Tarim Basin north through Dzungaria and extending across western Mongolia and the Gansu corridor into western Inner Mongolia, with a second band of exceptional deficits from southeastern Tibet into western Sichuan. Severe to exceptional surpluses were observed across the western Tibetan Plateau and northeastern Inner Mongolia, while moderate to severe deficits covered the Sichuan Basin, coastal regions from Shenzhen to Shanghai, the Korean Peninsula, and southern Japan. The seasonal forecasts (Aug 2026–Jul 2027; Figure 27) project exceptional deficits persisting across the Tarim Basin, Dzungaria, and western Mongolia through Jan 2027, with a second exceptional band reaching from Inner Mongolia and Ningxia south through Gansu into western Sichuan and Yunnan, while surpluses expand across the western Tibetan Plateau and emerge from Hunan to Zhejiang. By Feb–Apr 2027, moderate surpluses spread across northeastern China and southern China from Guangxi to Fujian, as severe deficits linger in Yunnan and Guizhou.
Australia and New Zealand: Observed long-term conditions (Nov 2025–Oct 2026; Figure 28) show severe to exceptional surpluses across the Top End of the Northern Territory, Cape York, and the Gulf Country, extending south through the Lake Eyre basin. Exceptional deficits covered inland Western Australia east of Shark Bay, with severe to exceptional deficits in the Great Southern region south of Perth and across Tasmania, while moderate to severe deficits stretched across southern Queensland and northern New South Wales. The seasonal forecasts (Aug 2026–Jul 2027; Figure 29) project surpluses persisting across Cape York and spreading down the Queensland and New South Wales coasts through Jul 2027 as Western Australia’s deficits fade to near-normal by Nov 2026–Jan 2027. However, exceptional deficits are expected across New Zealand’s North Island and severe deficits across Tasmania in Nov 2026–Jan 2027, before both ease by Feb–Apr 2027.