
These maps present regions currently experiencing long-term (12 month) anomalies using observed temperature and precipitation data from October 2025 through September 2026 (top) and regions likely to encounter significant water anomalies during the one-year period beginning in July 2026 and running through June 2027 using 3 months of observed data and 9 months of forecast data (bottom).
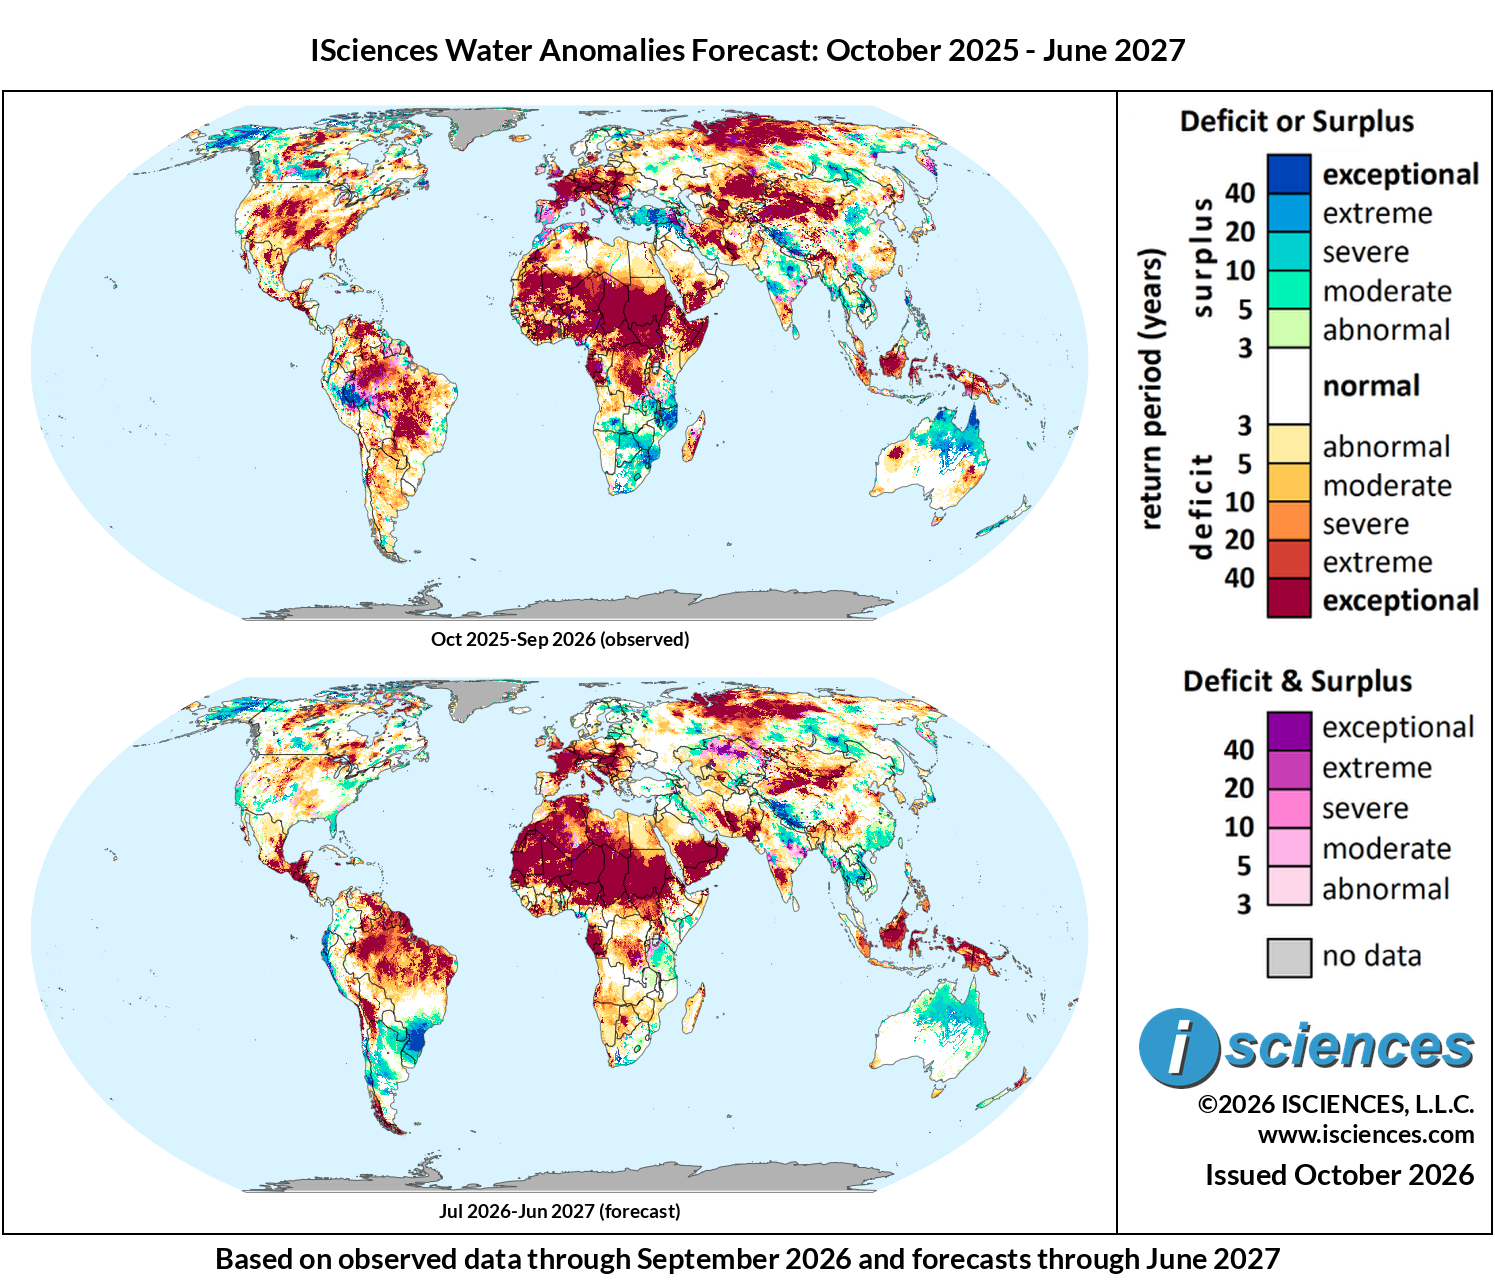
Figure 1: Worldwide water anomaly. Top: 12-month observed, Oct 2025–Sep 2026. Bottom: 12-month forecast, Jul 2026–Jun 2027
The in focus and regional synopsis sections that follow provide highlights of regional water forecasts. Detailed regional maps are available in the full report: ISciences Global Water Monitor & Forecast Watch List October 14, 2026 (pdf).
In Focus
El Niño Nears Its Peak
El Niño continued to build through September and remains on course to become one of the most powerful events in the instrumental record. In its September diagnostic discussion, NOAA’s Climate Prediction Center placed the odds of a very strong event this fall and winter above 90% and gave a 75% chance that it will rank as the strongest El Niño since 1950. UN News reports that sea surface temperatures in the central Pacific have already reached levels on par with the historic 1997 and 2015 events, and the broader suite of seasonal forecast models continues to point toward a record-setting peak later this year.
The NOAA CFSv2 ensemble that drives WSIM’s forecasts is shown here on the relative Niño 3.4 index (Figure 2), which measures Pacific warming against the tropical oceans as a whole and underpins the Relative Oceanic Niño Index (RONI) that NOAA adopted for official ENSO monitoring in early 2026. On this index, observed values climbed from about -1 °C in January to roughly 2.2 °C by September. The ensemble mean peaks near 2.8 to 2.9 °C from October through December, holding above the 2.5 °C threshold the Climate Prediction Center uses to define a historic event, before declining steadily through early 2027. The forecast returns to ENSO-neutral by around May 2027, with a number of members dipping below zero by June. The water anomaly forecasts throughout this report are built on this trajectory, with El Niño’s strongest influence expected through the end of 2026 and fading into the spring.
No matter what the final magnitude ends up being, the human exposure could be enormous: UNICEF estimates that more than 347 million children in nearly 100 countries live in areas expected to see unusually wet or dry conditions between October and December, 190 million of them in Asia and the Pacific. The sections below follow these signals into Ethiopia, India, and the islands of Southeast Asia and the western Pacific.
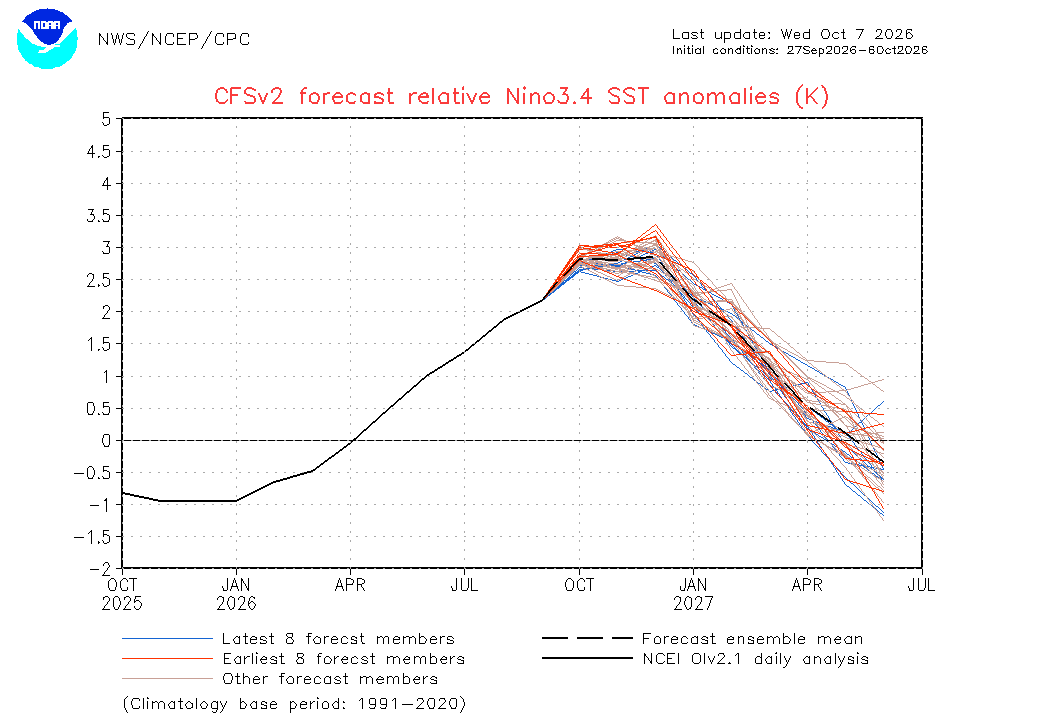
Figure 2: NOAA CFSv2 forecast of relative Niño 3.4 SST anomalies (K), initial conditions September 27 to October 6, 2026. Source: NOAA NWS/NCEP/CPC.
Ethiopia: Conflict and Crop Failure in the North
Northern Ethiopia is sliding back toward war at the same moment its main rainy season has failed. On September 23, Tigrayan fighters took control of the main airport at Mekelle and fought federal troops in neighboring Afar and Amhara, days after the Tigray People’s Liberation Front joined a new alliance of seven armed groups seeking to overthrow the federal government. Addis Ababa responded with drone strikes, including one that hit a convoy carrying food aid. The UN said it was “gravely concerned” as fighting spread across multiple fronts; internet and phone service have been largely cut across Tigray, and UN human rights chief Volker Türk said reported airstrikes hit five schools in the region on September 22. The 2020–2022 war between the same parties killed an estimated 600,000 people.
The humanitarian impacts were already dire before the fighting resumed. Tigray’s El Niño drought response plan identified 3.7 million people in need, including more than 900,000 internally displaced people, yet had secured only $3.38 million of the $626.8 million required. The June–September Kiremt rains, which support more than 70% of Ethiopia’s crop production, were forecast to start late and end early under El Niño. A September 17 government assessment seen by The New Humanitarian found that “many households” in Tigray are now experiencing complete crop failure, warning that “without continued rainfall, even minimal production cannot be expected.” The drought also met the threshold for a $300,000 parametric insurance payout in Ethiopia through the Natural Disaster Fund’s anticipatory drought cover. WSIM estimates that roughly 90% or more of Tigray’s population has been exposed to water deficits in every month since June, a sharp reversal from early 2026 when surpluses dominated, and the forecast holds exposure near that level well into 2027 (Figure 3).
The outlook for the October–December short rains is where WSIM and the regional consensus differ, mainly in timing. The IGAD Climate Prediction and Applications Centre (ICPAC) gives a 90% likelihood of enhanced rainfall over southern Ethiopia, central and southern Somalia, and northeastern Kenya, and Hausfather notes that this region was wetter than normal during October–December in all eight strong El Niño events since 1957, a relationship driven as much by the positive Indian Ocean Dipole that typically accompanies El Niño as by the Pacific itself. WSIM’s CFSv2-driven forecast delays that wet signal, with scattered moderate surpluses appearing across south-central Ethiopia by January–March 2027 and expanding into the northeast, including parts of Tigray, from April 2027. However, much of the population is still expected to be under deficit conditions (Figure 3).
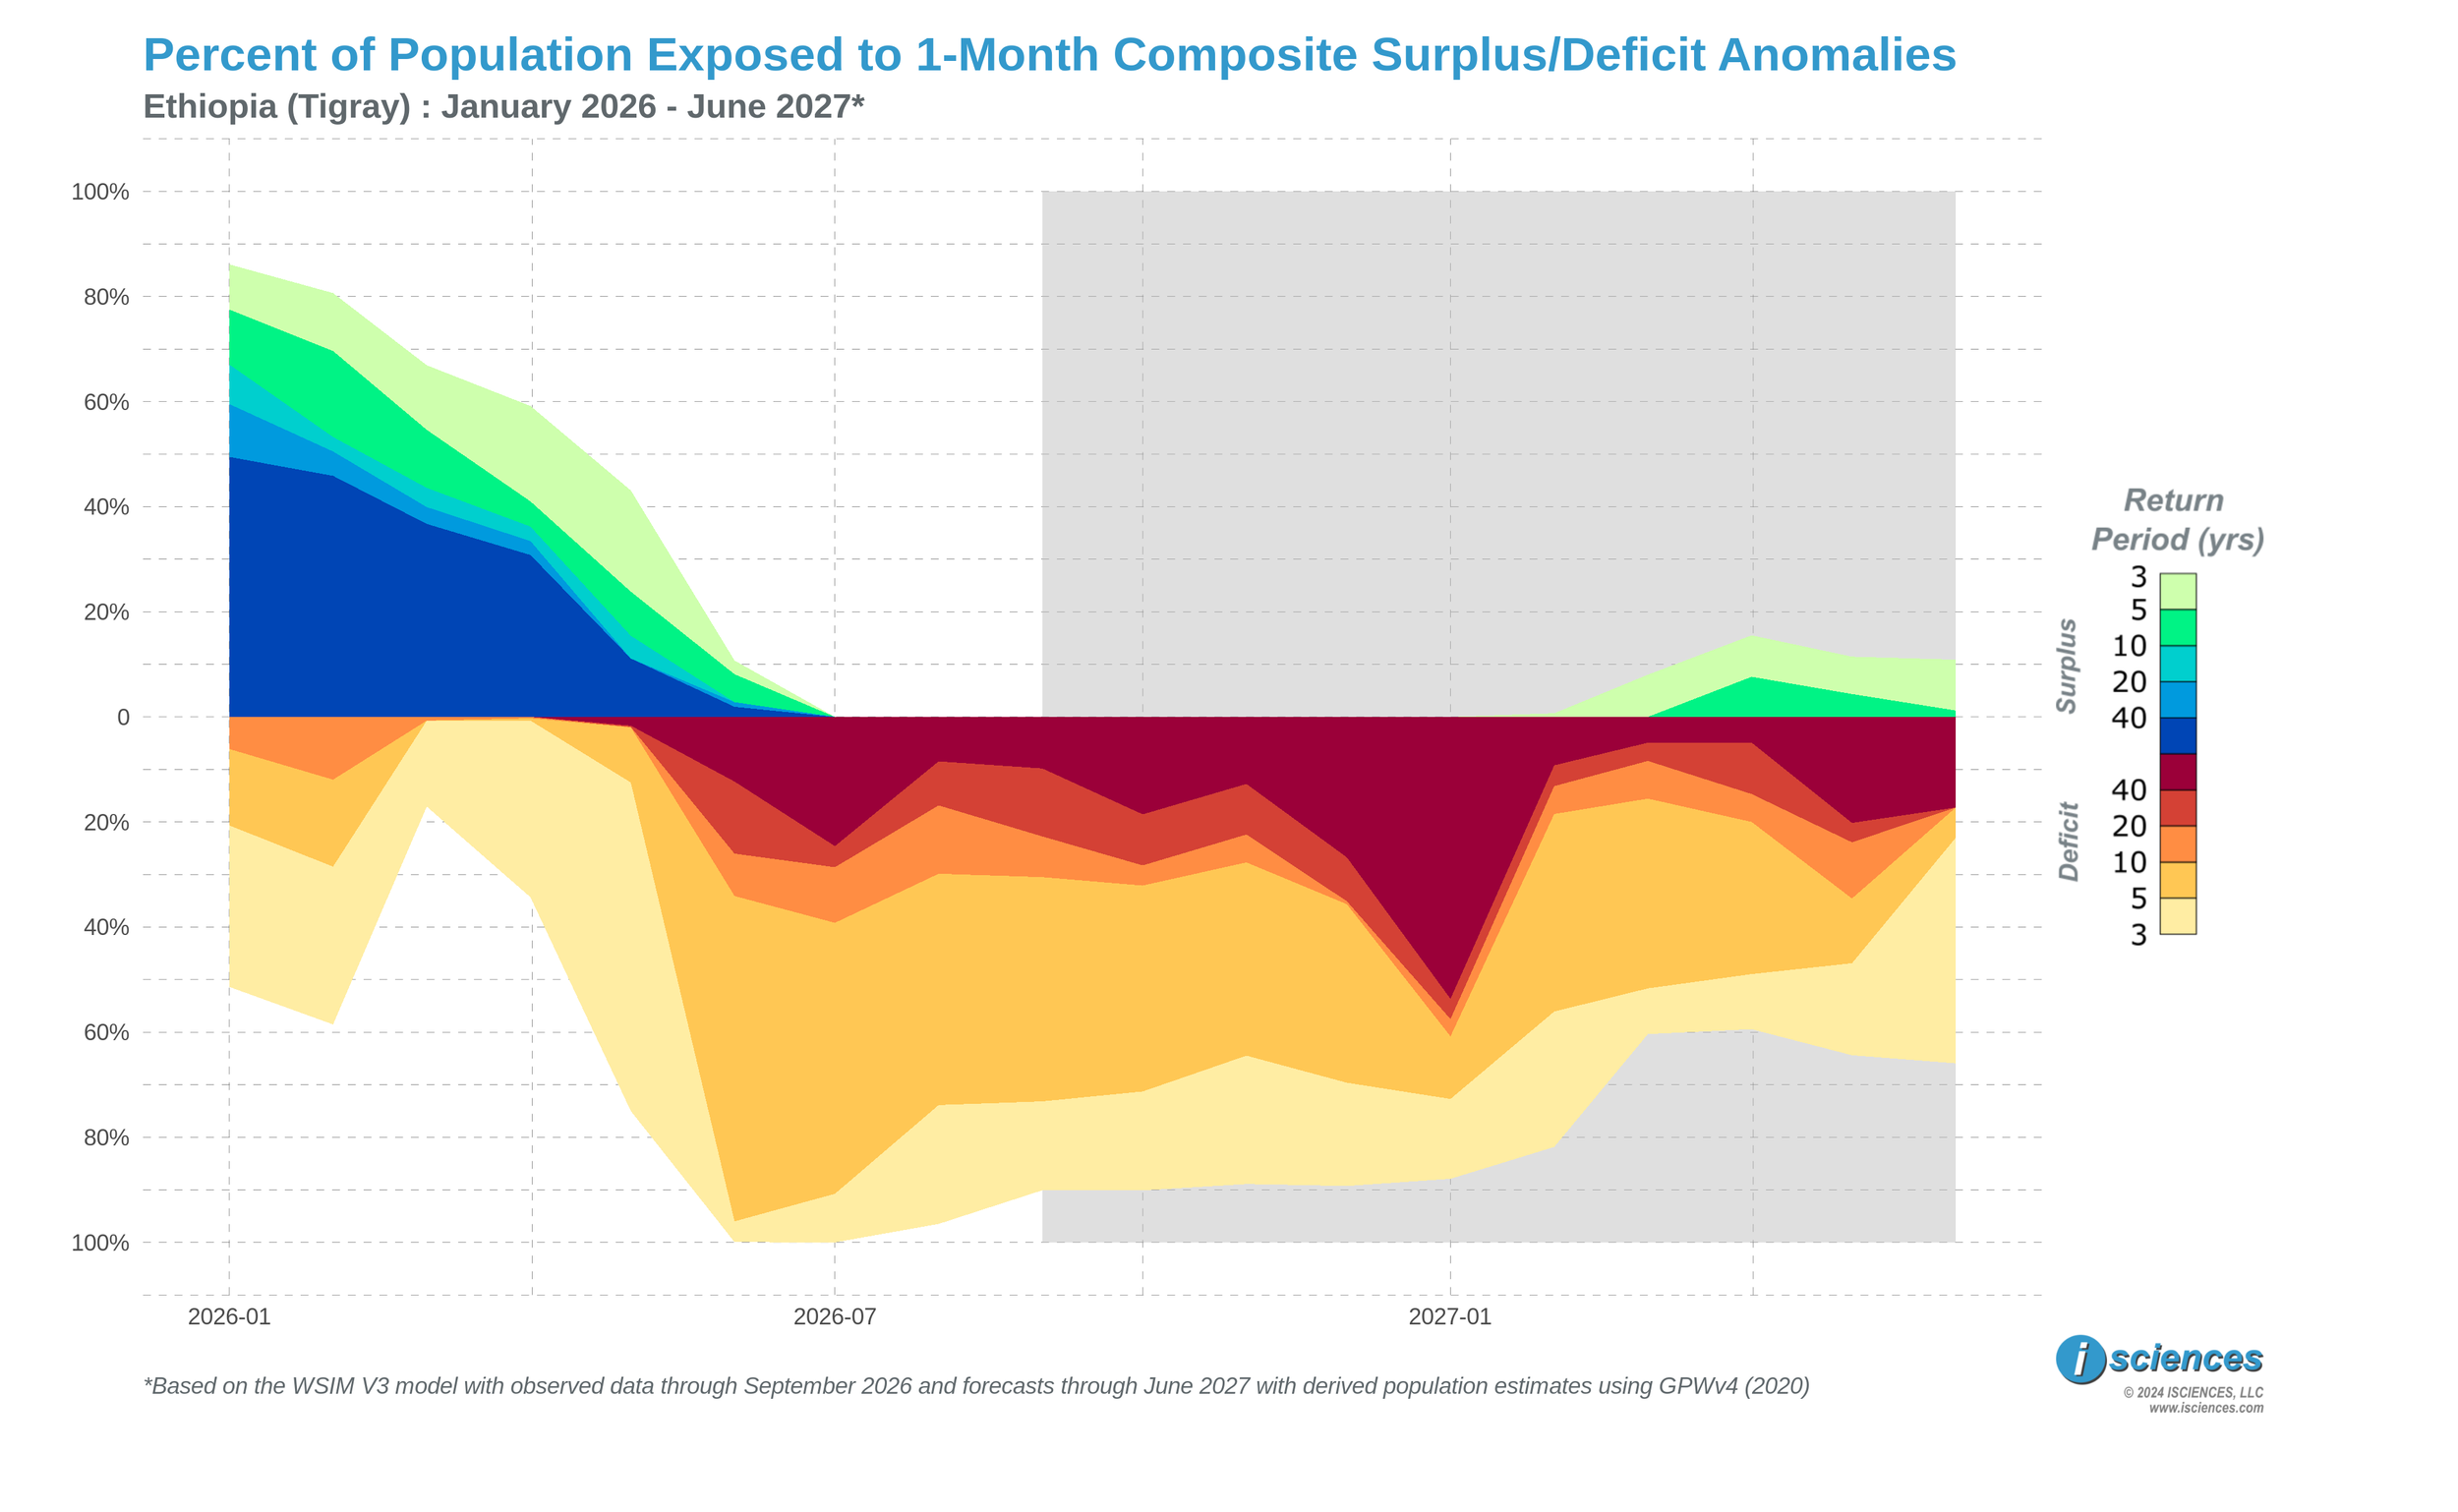
Figure 3: Percent of Tigray’s population exposed to 1-month composite water surplus (above zero) and deficit (below zero) anomalies, January 2026–June 2027. Shaded region indicates the forecast period. Population estimates derived from GPWv4 (2020). Source: ISciences WSIM V3.
India’s Lopsided Monsoon
According to the India Meteorological Department (IMD), India’s southwest monsoon ended on September 30 with 87% of its long period average rainfall, making 2026 the fourth-weakest season since 2001 and the 13th-weakest since records began in 1901. The national total masks a highly uneven season. June delivered just 65% of normal rainfall, July recovered to 101%, and August and September fell back to 84% and 92%. Central and Northwest India finished near normal, while East and Northeast India received 1,017 mm, the lowest total for that region since 1901, with Assam, Meghalaya, and Arunachal Pradesh deficient in every month of the season, and the South Peninsula received 542 mm, its fourth-lowest on record. Seventeen of India’s 36 meteorological subdivisions, covering 42% of the country, recorded deficient rainfall; Odisha was the only subdivision with an excess. Just to the north, Nepal’s Prime Minister called for faster climate action at the UN General Assembly after catastrophic Himalayan floods in August. WSIM’s monthly total blue water anomalies (Figure 4) mirror the IMD record, with exceptional deficits persisting across the Northeast and building along the Karnataka and Kerala coast while central India and Odisha ran surpluses.
State-level numbers show how a near-normal figure can hide real stress. Telangana finished the season 17% below normal, technically within IMD’s “normal” band, yet 18 of its 33 districts were officially deficient, led by Jogulamba Gadwal at 41% below normal. On October 1, state Agriculture Minister Tummala Nageswara Rao directed officials to identify drought-affected mandals using rainfall, dry spells, soil moisture, reservoir and groundwater levels, and crop condition. The Indian Ocean offered less help than many had hoped. Some meteorologists expected the Indian Ocean Dipole to turn positive around September, a pattern that buffered India against El Niño in 1994 and 1997, but the IOD remained neutral, and the Indian National Centre for Ocean Information Services suggests central Pacific warming could persist through May 2027. Looking further ahead, there is some reassurance in the historical record: Hausfather finds that the monsoon in the year following a strong El Niño was near or above normal in seven of eight past cases, so the current event does not by itself point to a second failed monsoon in 2027.
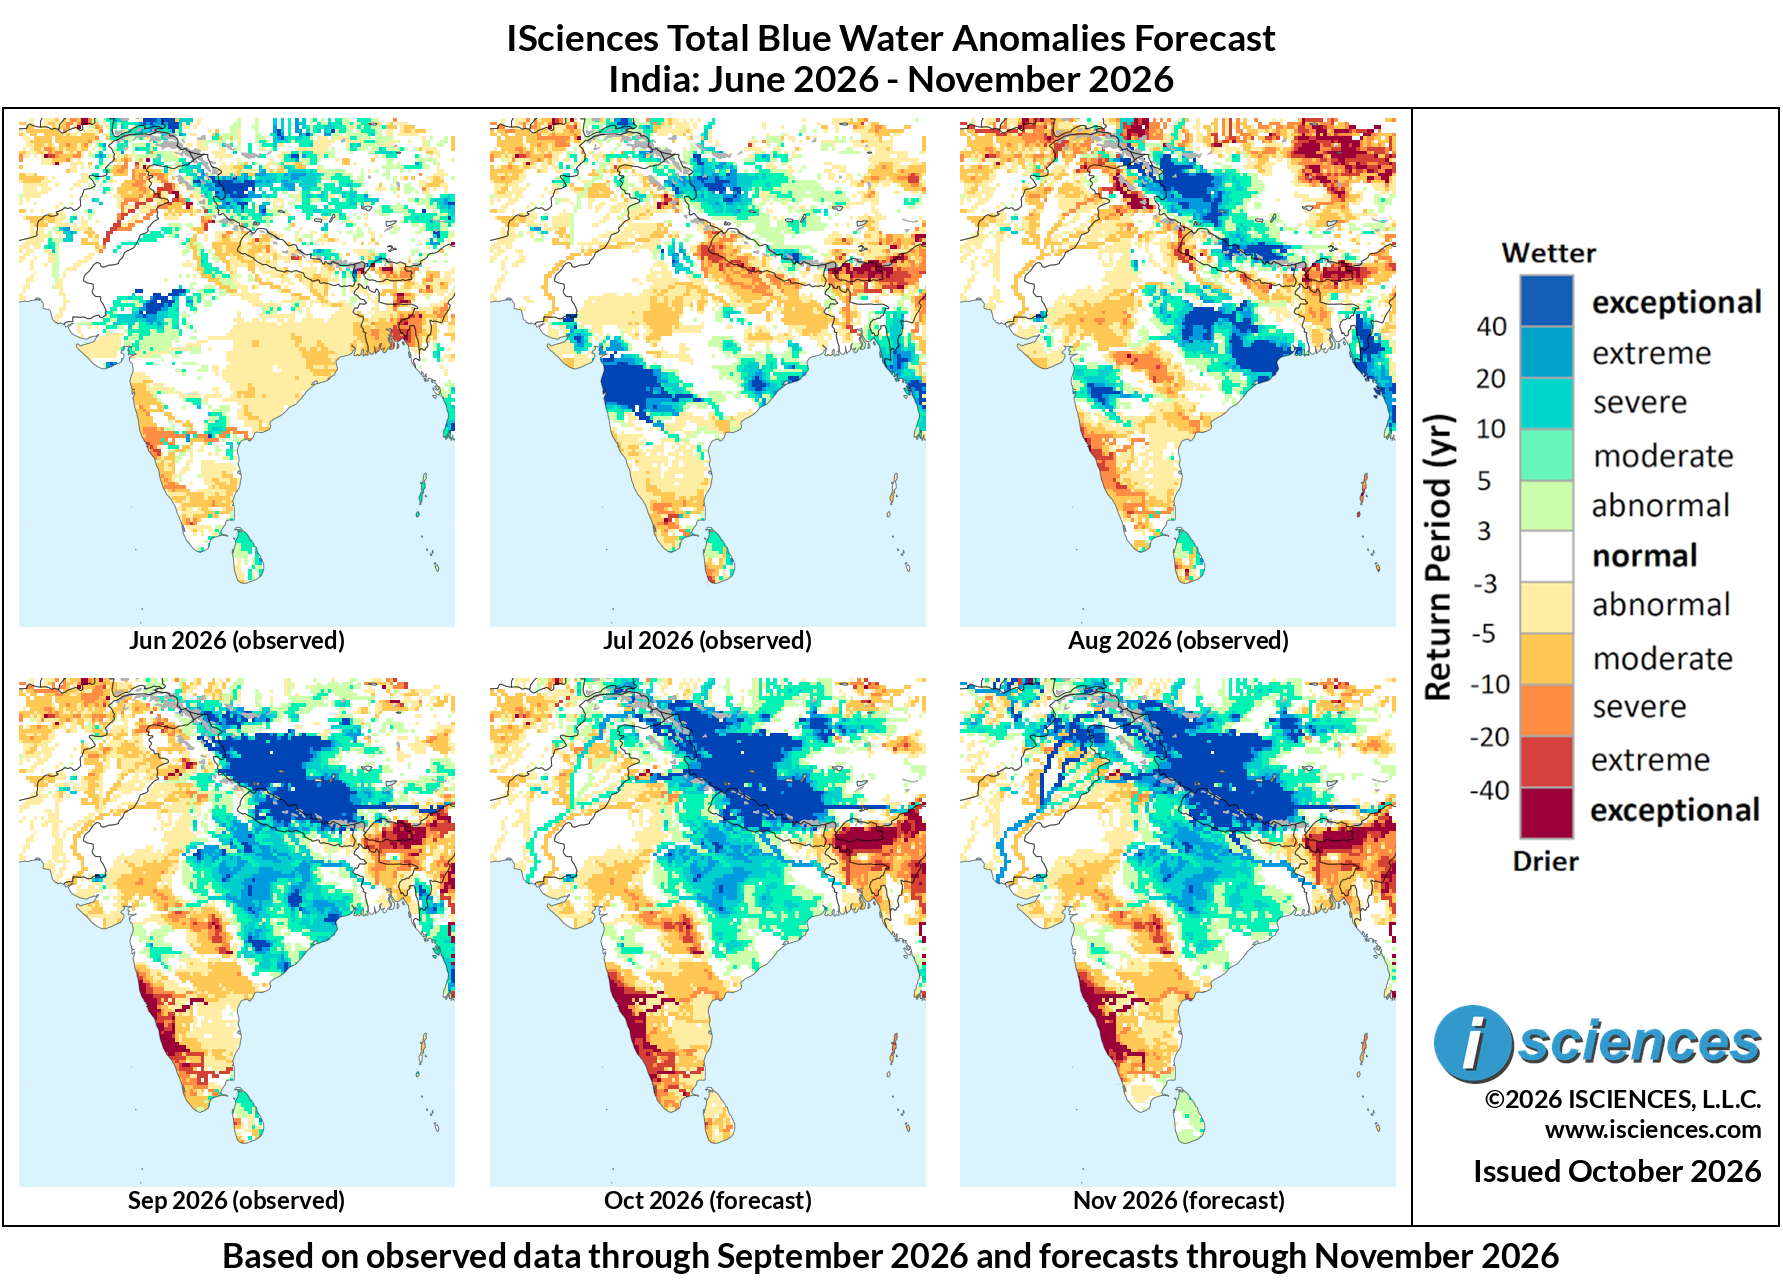
Figure 4: ISciences total blue water anomalies for India, June–November 2026 (1-month panels; June–September observed, October–November forecast). Source: ISciences WSIM V3.
Southeast Asia and the Western Pacific: From Haze to Hunger
The effects of El Niño’s impacts in the Maritime Continent have been pervasive and severe. Indonesia’s forestry minister Raja Juli Antoni called September “the main fight for us,” as haze from drought-fueled fires forced thousands of schools to move classes online and spread hazardous air into Malaysia. By September 21, satellites had detected 5,283 hotspots in Central Kalimantan alone, along with 1,485 in South Sumatra and 1,357 in West Kalimantan, and Indonesia’s meteorological agency expects the rainy season to begin later than normal across more than 60% of the country. WSIM’s net precipitation record for Palangka Raya, the capital of Central Kalimantan (Figure 5), shows July and August 2026 at exceptional dry levels, with the forecast returning toward normal by December as the delayed rainy season arrives.
Papua New Guinea offers an early look at what follows. UN News reports the government declared the El Niño event in June, established a dedicated task force, and approved a $112 million supplementary budget. Some 1.2 million people are now estimated to need direct food relief as water sources dry up, crops fail, and food prices rise, and the largest impacts on agriculture are not expected until November. WSIM shows exceptional deficits across nearly all of New Guinea since July, persisting through the October–December forecast. Elsewhere in the western Pacific, Vanuatu has declared drought across its northern islands and Fiji’s weather service has warned of very dry conditions.
The Philippines shows how quickly El Niño’s effects can swing. Writing in the Philippine Daily Inquirer, agronomist Teodoro Mendoza describes how a negative Indian Ocean Dipole fed extra moisture into the southwest monsoon in August and September, temporarily canceling El Niño’s drying influence. Metro Manila and western Luzon received 305 mm of rain from August 28 to 30, the Ipo and La Mesa dams spilled, and flooding and landslides struck Pampanga, Rizal, and Metro Manila, with infrastructure damage estimated at ₱6.3 billion and agricultural losses at ₱2.2 billion. The second phase is now beginning. Mendoza cites projected rainfall reductions of 40% to 60% across Luzon and the Visayas and 60% to 80% in Mindanao between October and May. WSIM captures both phases, with surpluses along western Luzon in July–September giving way to deficits across the archipelago in the October–December forecast. Dry Philippine winters are among the most reliable El Niño impacts on record; December–April rainfall fell below normal in all eight past strong events, at a median of 58% of normal.
On the mainland, the Inquirer report links the same negative-IOD moisture to flooding that submerged more than 50 districts in Thailand. As UN News notes, the UN Economic and Social Commission for Asia and the Pacific points to the 2015–16 El Niño as a warning: more than 70% of Southeast Asia’s land area experienced drought during that event, exposing more than 200 million people at its peak. This time, the shock arrives amid tighter government finances, elevated debt, and persistent supply chain worries, leaving governments and households with less room to absorb it.

Figure 5: WSIM V3 net precipitation anomaly time series for Palangka Raya, Central Kalimantan (return period, years), January 2023–June 2027. Source: ISciences WSIM V3.
Watch List: Regional Synopsis
This synopsis provides highlights of regional water forecasts. More detailed analysis is available in “Watch List: Regional Details” immediately following the synopsis.
United States: Observed long-term conditions (Oct 2025–Sep 2026) show moderate to exceptional deficits across most of the contiguous U.S., with exceptional cores spanning the central Rockies from Utah and Wyoming into Nebraska, Oklahoma, the lower Mississippi Valley through Arkansas and Louisiana, and the Mid-Atlantic from Virginia into Pennsylvania. Alaska stands apart with severe to exceptional surpluses. The seasonal forecasts (Jul 2026–Jun 2027) project El Niño-driven relief, with surpluses emerging by Jan–Mar 2027 along the California coast, across the Southwest and Gulf Coast, and up the Atlantic seaboard from Florida to New England, while deficits persist in Wyoming and Colorado through Mar 2027 and in the Upper Midwest around Lake Superior through Jun 2027.
Canada: Observed long-term conditions (Oct 2025–Sep 2026) show severe to exceptional surpluses across the Yukon, contrasting with exceptional deficits through the Northwest Territories between Great Bear and Great Slave Lakes and across northern Saskatchewan and central Manitoba. Severe surpluses covered central and southern Alberta and Saskatchewan, while extreme to exceptional deficits were observed in northern Ontario and Nova Scotia. The seasonal forecasts (Jul 2026–Jun 2027) project exceptional deficits remaining throughout the Northwest Territories and intensifying across northern Ontario and western Quebec north of Lake Superior through Mar 2027, while surpluses persist in central and southern Alberta and Saskatchewan and emerge across southern Quebec, New Brunswick, and Nova Scotia in Jan–Mar 2027.
Mexico, Central America, and the Caribbean: Observed long-term conditions (Oct 2025–Sep 2026) show exceptional deficits across Sonora, Tamaulipas, Chihuahua, and Durango and along the Pacific coast from Jalisco through Oaxaca, continuing through Chiapas into Guatemala, El Salvador, Honduras, and western Nicaragua. Jamaica and Hispaniola registered mixed and deficit conditions, while eastern Cuba saw moderate to severe surpluses. The seasonal forecasts (Jul 2026–Jun 2027) project relief across northern Mexico and the Caribbean by Oct–Dec 2026, but exceptional deficits are expected to persist across Chiapas and the Central American Dry Corridor through Mar 2027 before expanding into Veracruz, Puebla, and Oaxaca in Apr–Jun 2027.
South America: Observed long-term conditions (Oct 2025–Sep 2026) show exceptional deficits across Venezuela’s Orinoco basin, the northern Amazon in Amazonas and Roraima, and central Brazil from Mato Grosso through Goiás and Tocantins, with moderate to severe deficits extending through Paraguay and Argentina. The western Amazon along the Peru-Brazil-Bolivia border stands apart with exceptional surpluses and mixed conditions. The seasonal forecasts (Jul 2026–Jun 2027) project exceptional surpluses across southern Brazil from Paraná and the area surrounding Curitiba to Rio Grande do Sul beginning Oct–Dec 2026, spreading into Uruguay and northeastern Argentina by Jan–Mar 2027. Exceptional deficits are expected to persist across the Amazon basin and the Altiplano of southern Peru and Bolivia through the forecast period.
Europe: Observed long-term conditions (Oct 2025–Sep 2026) show an exceptional deficit core stretching from eastern Spain east through France, Germany, Switzerland, Austria, Czechia, and Poland into Hungary and the Danube basin, with exceptional deficits also across southern Italy and mixed conditions in southern England, western Iberia, and the southern Balkans. Surpluses were limited to northern Finland and northwestern Russia. The seasonal forecasts (Jul 2026–Jun 2027) project deficits remaining but reducing in intensity through Dec 2026. However, El Niño is expected to return most of the continent to normal to moderate surplus conditions by Jan–Mar 2027. Severe to exceptional deficits are forecast to remain in the Poland-Belarus-Ukraine border zone through Jun 2027.
Africa: Observed long-term conditions (Oct 2025–Sep 2026) show exceptional deficits across the Sahel from Mauritania through Mali, Niger, Chad, and Sudan, extending south along the Gulf of Guinea into Gabon and the Republic of the Congo and east across Ethiopia and Somalia. Severe to exceptional surpluses blanketed Tanzania, Mozambique, Malawi, and eastern South Africa. The seasonal forecasts (Jul 2026–Jun 2027) project Sahel deficits persisting from Senegal to northwest Ethiopia through Mar 2027, while surpluses continue around Lake Victoria and western Tanzania and scattered moderate surpluses emerge in south-central Ethiopia in Jan–Mar 2027; by Apr–Jun 2027, exceptional deficits are expected to develop across Botswana, Zimbabwe, and northern South Africa.
Middle East: Observed long-term conditions (Oct 2025–Sep 2026) show extreme to exceptional surpluses across central and eastern Turkey and the headwaters of the Euphrates and Tigris, with exceptional mixed conditions in southeastern Turkey and northern Iraq and moderate to exceptional surpluses tracing the Zagros Mountains toward the Persian Gulf. Exceptional deficits covered nearly all of central and northern Iran, Yemen, and the Asir highlands of southwestern Saudi Arabia. The seasonal forecasts (Jul 2026–Jun 2027) project surpluses along the Tigris and the Iraq-Iran border into southwestern Iran through Mar 2027, while exceptional deficits persist across Yemen and Oman and expand into central Saudi Arabia around Riyadh through Apr–Jun 2027.
Central Asia and Russia: Observed long-term conditions (Oct 2025–Sep 2026) show exceptional deficits across western Siberia from the Yamal Peninsula south through the Ob basin, and a second broad core spanning northern and eastern Kazakhstan, the Altai, and western Mongolia into Xinjiang’s Tarim Basin. Surpluses were limited to areas east of Lake Baikal and west of the Ural Mountains. The seasonal forecasts (Jul 2026–Jun 2027) project Kazakhstan, Uzbekistan, and Turkmenistan’s deficits easing to abnormal levels by Oct–Dec 2026 and surpluses emerging along the Amu Darya and Syr Darya and across Tajikistan and Kyrgyzstan in Jan–Mar 2027, spreading into northern Kazakhstan by Apr–Jun 2027, while exceptional deficits persist across northwestern Siberia through the forecast period.
South Asia: Observed long-term conditions (Oct 2025–Sep 2026) show exceptional surpluses across Nepal and the central Himalaya, with moderate to exceptional surpluses extending across Gujarat, Madhya Pradesh, Chhattisgarh, Maharashtra, and the Odisha coast. Exceptional deficits were observed in Balochistan and in the eastern Himalaya across Bhutan and Arunachal Pradesh, while severe to exceptional deficits covered southern Andhra Pradesh and eastern Karnataka. The seasonal forecasts (Jul 2026–Jun 2027) project Himalayan surpluses persisting through Mar 2027, while deficits deepen across western India, with exceptional deficits spreading across Gujarat, southern Rajasthan, and the Konkan coast in Jan–Mar 2027 and persisting over Gujarat, Sindh, and the Indus basin into Apr–Jun 2027.
Southeast Asia and the Pacific: Observed long-term conditions (Oct 2025–Sep 2026) show exceptional deficits across Borneo, Sulawesi, southern Sumatra, and New Guinea, with severe deficits along Java and the Malay Peninsula. Mainland surpluses were concentrated in Laos, Cambodia, and central Vietnam, with exceptional surpluses in northern Luzon. The seasonal forecasts (Jul 2026–Jun 2027) project exceptional deficits persisting across Borneo, Sulawesi, and New Guinea through Dec 2026 and spreading across the Philippines from Oct–Dec 2026 into Mar 2027, while surpluses strengthen across Myanmar, Thailand, Laos, and Cambodia into early 2027; by Apr–Jun 2027, deficits contract toward East Kalimantan and New Guinea’s northern coast.
East Asia: Observed long-term conditions (Oct 2025–Sep 2026) show exceptional deficits blanketing Xinjiang, western Mongolia, and the Gansu and Inner Mongolia corridor, with a second band of exceptional deficits along the eastern edge of the Tibetan Plateau in western Sichuan. Severe to exceptional surpluses were observed across the western Tibetan Plateau and northeastern China, while moderate deficits covered Jiangxi, Zhejiang, and much of southern Japan. The seasonal forecasts (Jul 2026–Jun 2027) project exceptional surpluses expanding across Tibet and western Qinghai through Mar 2027 and moderate surpluses reaching southern China from Guangxi to Fujian, as well as around Beijing, in Jan–Mar 2027, while severe deficits develop across the Sichuan Basin, Guizhou, and South Korea in Oct–Dec 2026 and persist across Mongolia into Mar 2027.
Australia and New Zealand: Observed long-term conditions (Oct 2025–Sep 2026) show severe to exceptional surpluses across the Top End of the Northern Territory, Cape York, and the Gulf Country, extending south through the Lake Eyre basin, along with exceptional surpluses on New Zealand’s South Island. Exceptional deficits covered inland Western Australia east of Shark Bay and the Darling Downs west of Brisbane, with severe deficits around Perth and in Tasmania. The seasonal forecasts (Jul 2026–Jun 2027) project northern surpluses persisting and expanding down the Queensland and New South Wales coasts by Jan–Mar 2027 as Western Australia’s deficits fade; however, extreme to exceptional deficits are expected across Tasmania and New Zealand’s North Island in Oct–Dec 2026.